Aye curumba, the recent bearing witness to PAX in Wellington, has reinvigorated the Church of PAX in Sydney, where recent attempts have been made to decipher the mystery of PAX, see below:
*Warning: Long Post*
In order to increase the understanding of
the divine mystery that is PAX, I have performed an analysis of PAX
against the crowd numbers for this seasons home games using simple
linear regression. However, in no way do I claim this to be a
comprehensive or accurate analysis of the figures as it is only a
sample of 14 observations and I couldn�t be bothered to double check
the figures or calculations.
Working only from the highest
reported PAX numbers offered by PAX acolytes in the affiliated threads
and attendances of each home game, I obtained the following data:
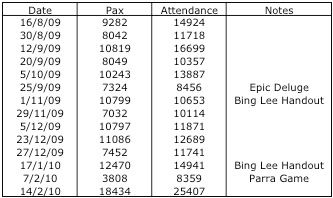
These figures include the PAX numbers listed prior to and after the matches. I then plotted the regression data as follows:
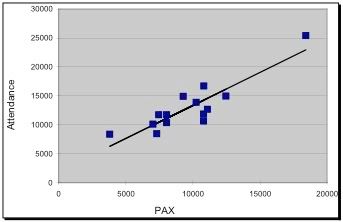
From the regression line a correlation coefficient of 0.8874 was obtained (r2
of 0.7875), that was much higher than I expected but still pretty
crappy. Furthermore, the slope and intercept of the plot were 1.138 and
1960 (walk up crowd and SCG trust members), respectively. Next, I
performed a two-tailed t-test on the correlation coefficient to
determine whether there is significant correlation between PAX and
Attendance:
� Ho: There is no correlation between PAX and Attendance.
� Ha: There is a significant correlation between PAX and Attendance.
� Test statistic:
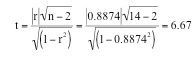
where, r is the correlation coefficient, and n is the number of observations
� The critical value for a two-sided t test for 2 degrees of freedom is 2.18 at the 5% significance level.
� Decision: Since 6.67 is greater than the critical value of 2.18, Ho is rejected.
� Conclusion: there is a significant correlation between PAX and attendance.
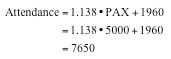
From
the graph above, the equation of the line was Attendance = 1.138 x PAX
No + 1960. Using the equation of the regression line, predictions of
match attendances could then be made from a given PAX no. For a PAX no
of 5000 the predicted attendance was determined in the following way:
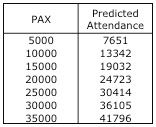
Further attendance estimates were obtained for a higher PAX number using a similar method to above.
Attendance
predictions from PAX numbers of 20K and above were determined with the
assumption that the relationship of PAX with attendance continues to be
linear past the observed range. This gave the following results:
 Note:
Note:
I also calculated the errors for these figures, however, they were
really, really, crap so I left them out to make it look better. Hence,
it is a pretty sh*te analysis. Can show them if anyone really wants.
In addition to the predicted crowd estimates using the regression data, I have also concluded that:
A) I�ve lost the plot and I need a job
B)
I would like the time back that I took to do this (not that it took
long, had old spreadsheets and lab reports) and I am sure you would
like the time back it took to read it as well
C) However, the most
important thing that I observed is that based on this analysis, there
does appear to be statistically significant correlation between the
highest observed PAX number and match attendance, that contradicts the
information from ticketek that there is no relationship. So any
non-believers should take note.
D) I would not expect this to
predict any crowd numbers, especially for the coming finals match. I
just thought it should be done for the benefit of all PAX followers.
Quite enjoyed reading that and taking it in. Fantasticly done Ginger!


